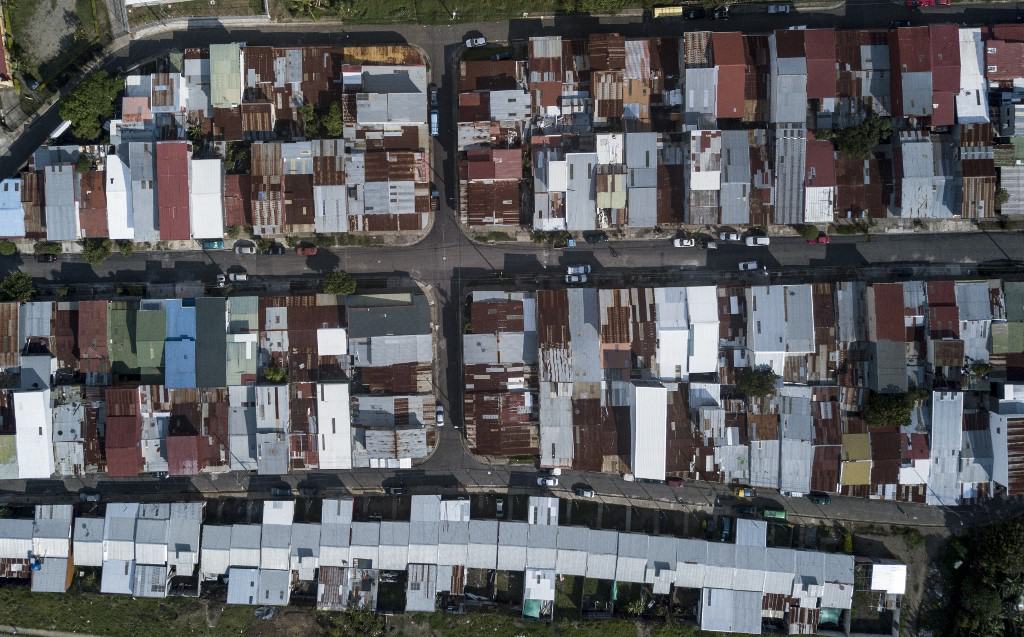
Poverty in Costa Rica reached 23% of households in 2021, representing a 3.2% decrease compared to last year but still the second-highest value recorded since 2010.
According to the 2021 National Household Survey, conducted in July by the National Institute of Statistics and Census (INEC), the poverty level reached 23.0% of homes, equivalent to 383,500 households. This corresponds to 36,000 fewer households than 2020, when poverty reached its highest level since 1992.
Some 6.3% of Costa Rican households are in extreme poverty, corresponding to 104,500 households in that situation. This is 0.7 percentage points less than 2020, but despite this drop, the extreme poverty level remains higher than before the pandemic (5.8% in 2019).
Poverty is higher in rural areas (26.3%) compared to urban areas (21.8%). Extreme poverty is also more common and increasing in rural areas.
A total of about 376,800 people in Costa Rica live in extreme poverty, meaning they cannot meet their basic food needs.
Costa Rica poverty by region
Costa Rica’s central region has the lowest levels of poverty and extreme poverty in the country, with 18.1% and 3.9%, respectively. Both figures decreased compared to 2020 — total poverty by 5.6 p.p., and extreme poverty by 2.1 p.p.
The Chorotega region has the second-lowest poverty level — 26.2%, or 5.5 p.p. lower than last year. The extreme poverty level was 8.5%.
In the case of the Central Pacific, total poverty was 30.9%, representing no significant variation since last year, while extreme poverty was 8.4%, a reduction of 2.9 p.p.
In the Huetar Caribe region, poverty is estimated at 32.4% while the Huetar Norte is at 31.9%. Both represent the highest levels registered since 2010 and increases in extreme poverty compared to last year.
The percentage of impoverished households in the Brunca region is at 33.5%, an increase of 7.0 p.p. compared to last year. Extreme poverty affected 10.2% of households. This region presents Costa Rica’s highest levels of poverty in 2021.
Costa Rica’s poverty gap
INEC calculated the Gini coefficient at 0.524, without significant differences with respect to the year 2020 and 2019.
The Gini coefficient is a summary measure of the inequality in the distribution of per capita income among households. Values closer to 1 indicate a greater concentration of income.


